Additional material
Interrupting the tuning session
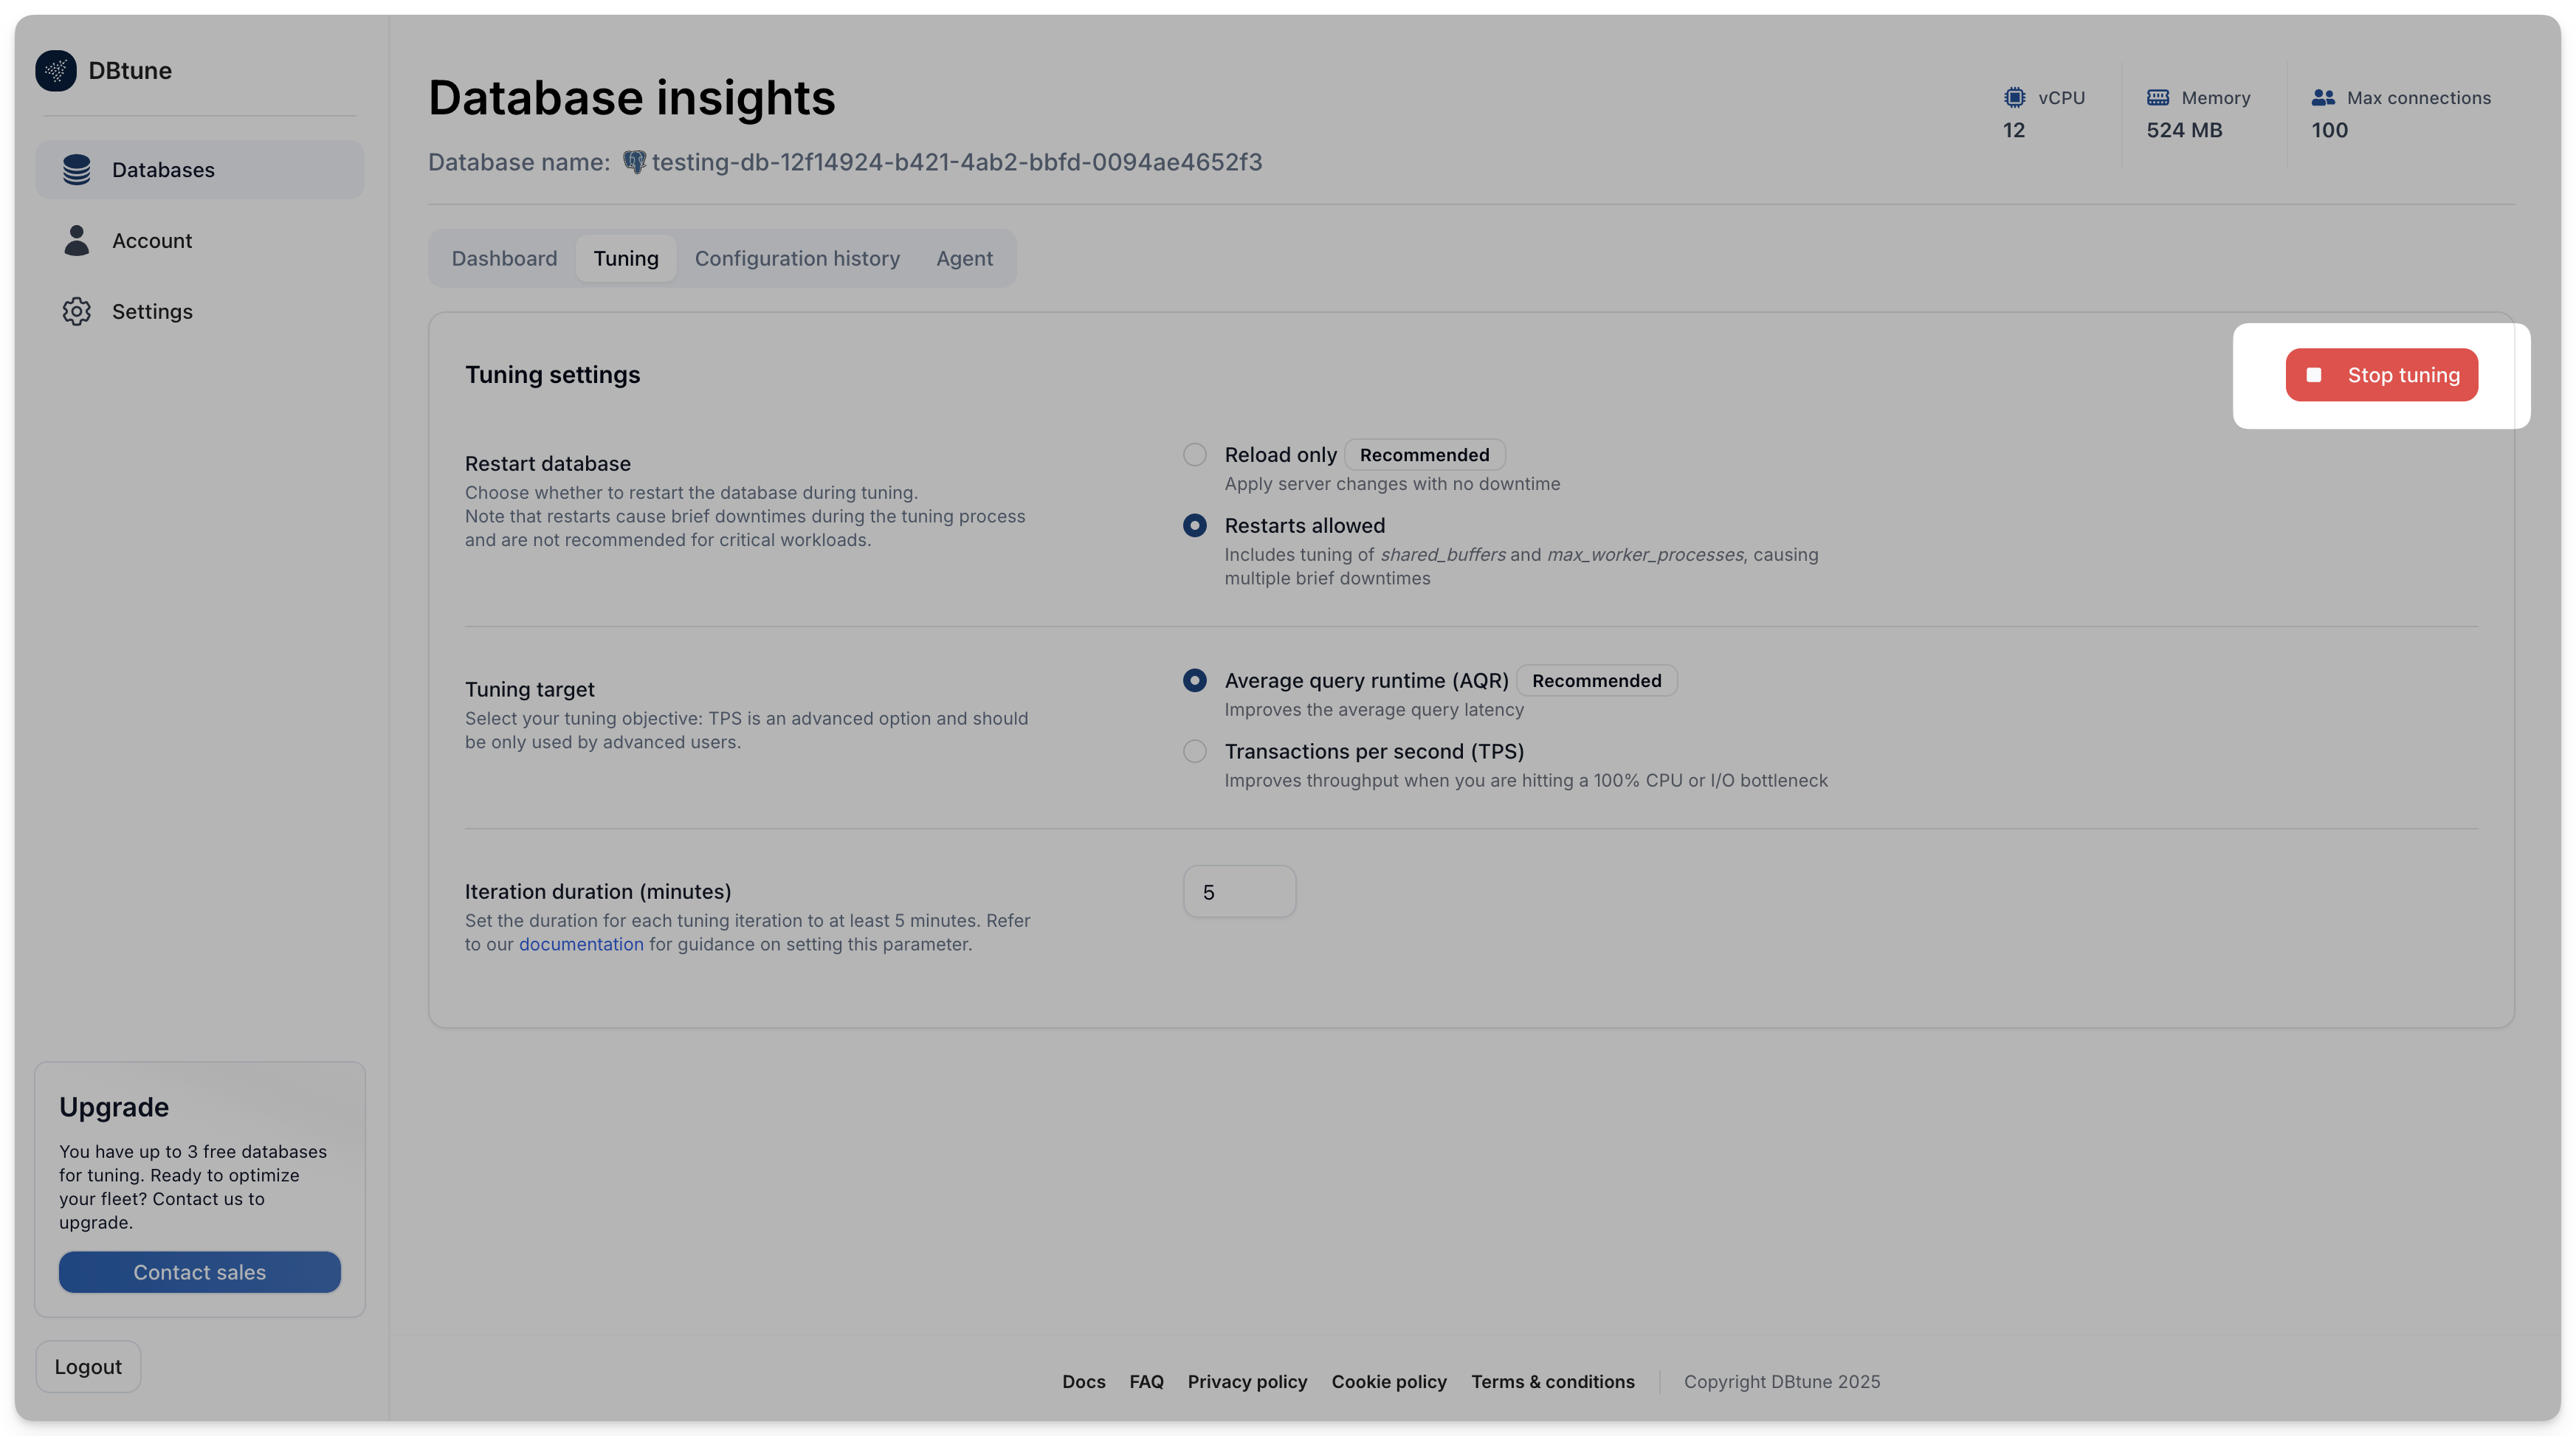
To stop the tuning sessions you can navigate to the Tuning data, and then press the Stop tuning button.
How to run subsequent tuning sessions
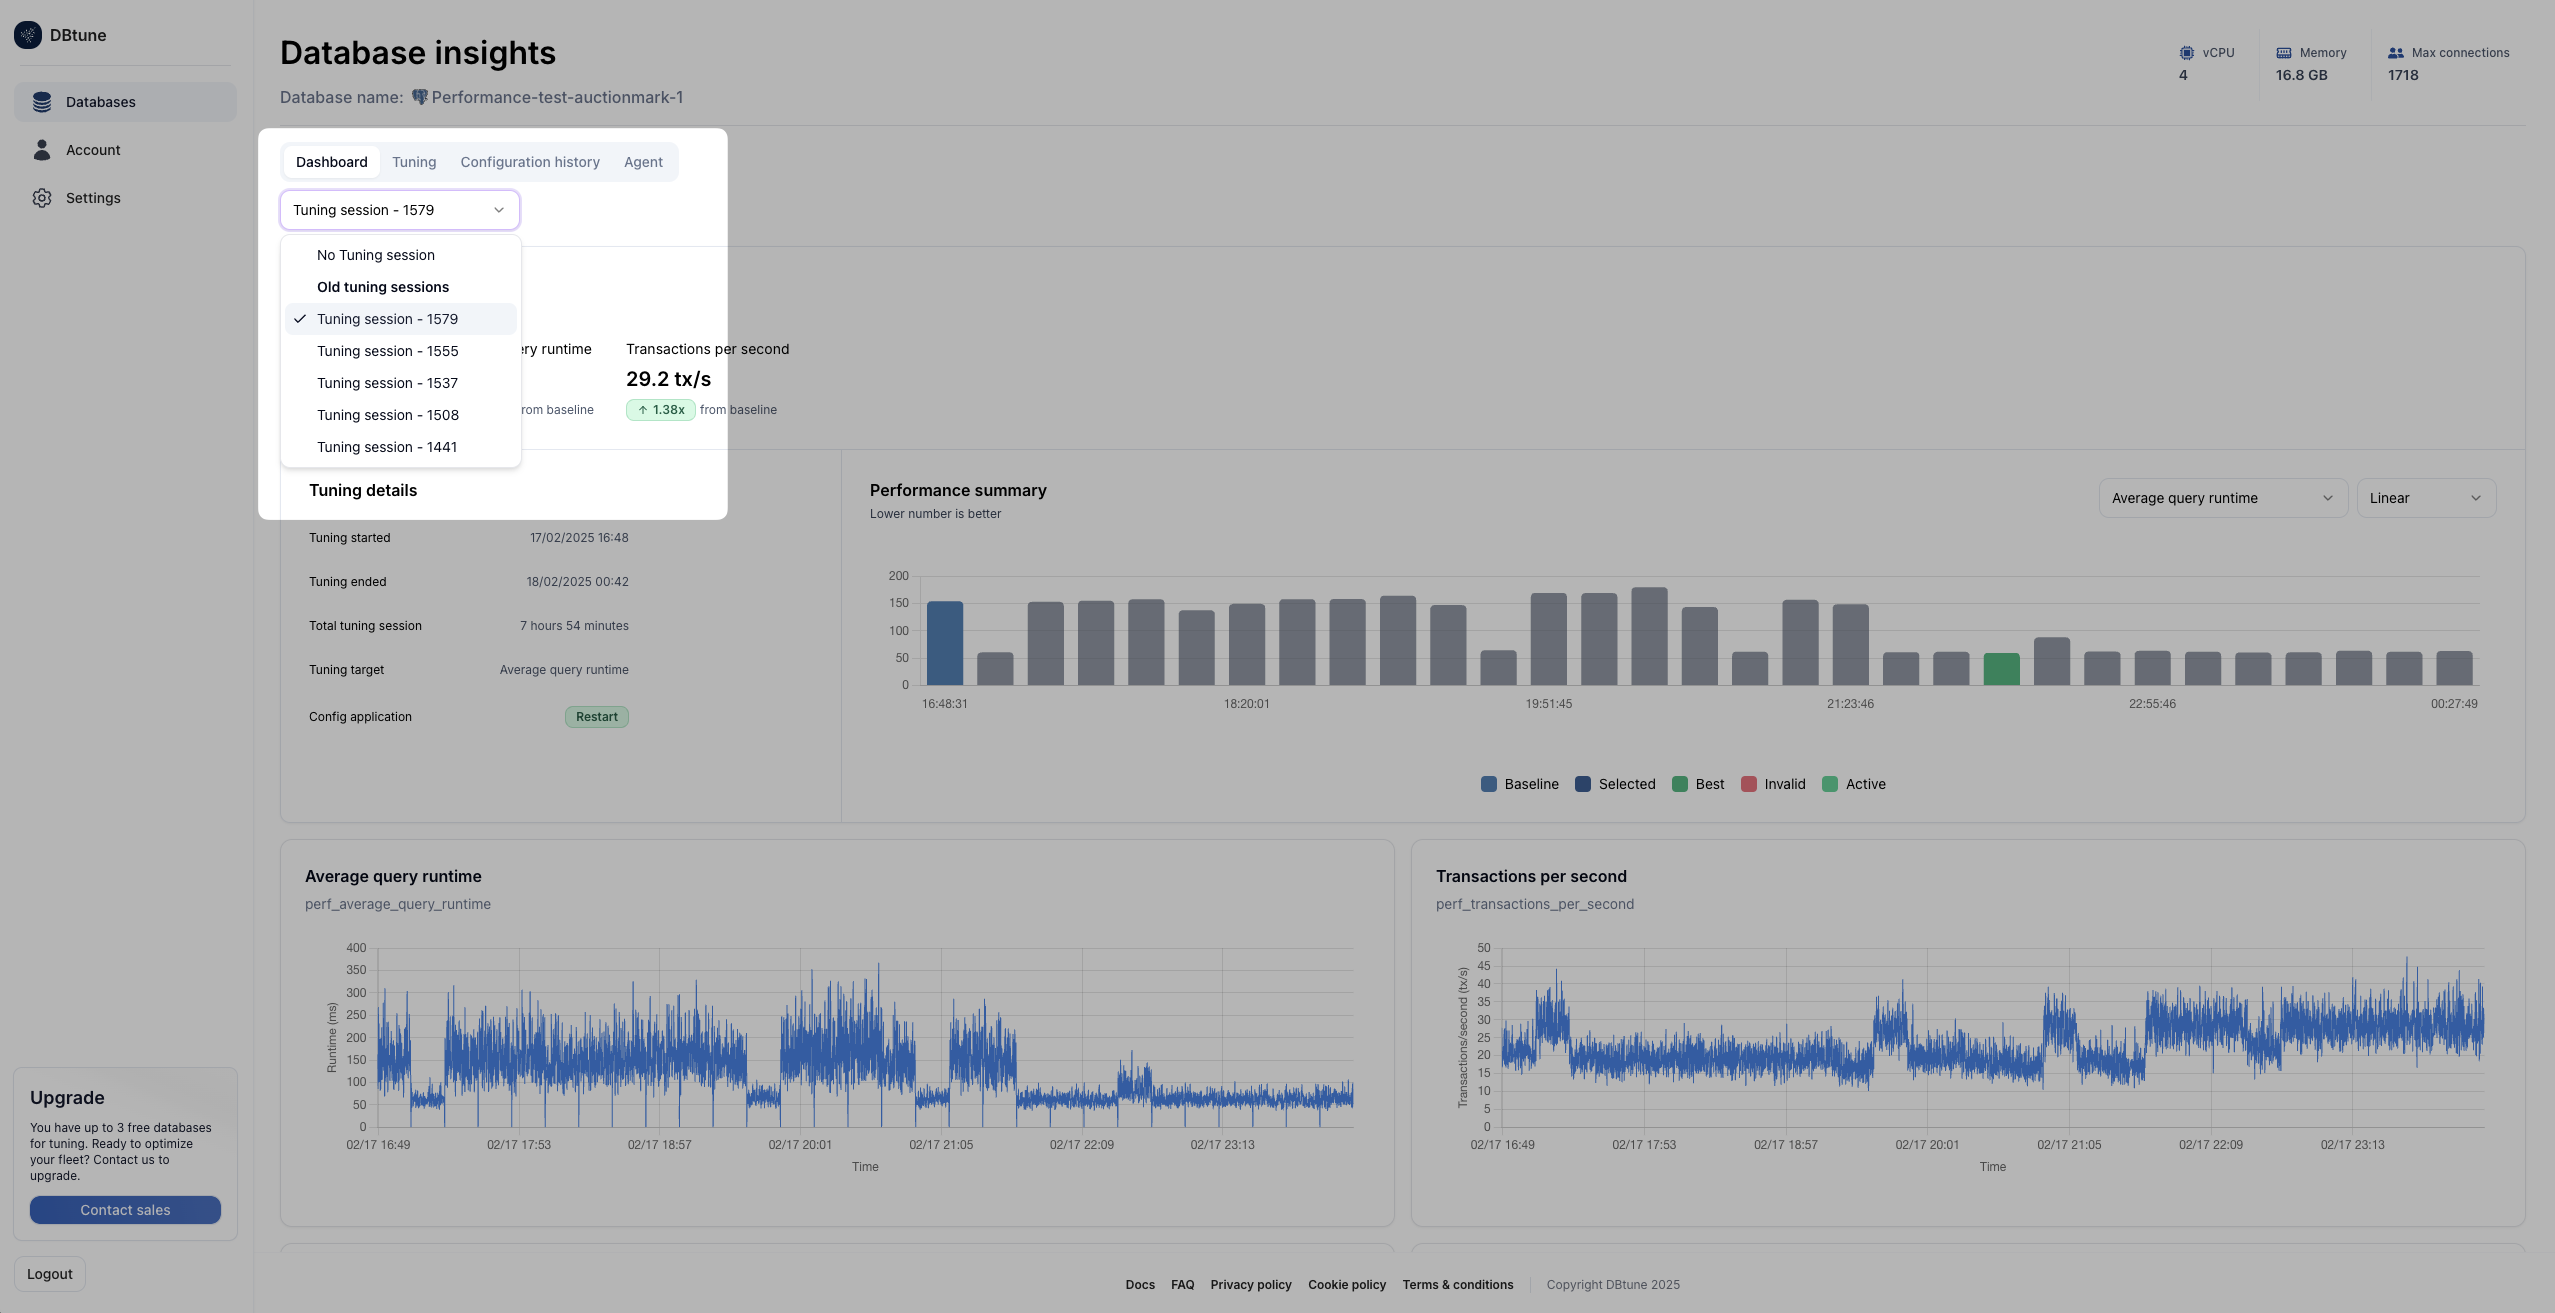
Once the initial tuning session is completed, the Stop tuning button is replaced by a Start tuning button. Previous tuning sessions will appear under the Tuning sessions dropdown on the left.
Modify memory usage guardrail threshold
The default DBtune agent adapter will automatically react and move away from PostgreSQL configurations that make the database instance use more than 90% available memory. This threshold can be customized in the DBtune agent. The line to modify is here. We will soon make this configurable when you start the agent.
Choose alternative optimization target
The default target optimization is average query runtime which is a form of latency (measured in milliseconds). Tuning for average query runtime will probably also have the effect of improving the number of transactions per second (TPS) which is a form of throughput.
You can change the optimization target in the Tuning tab.
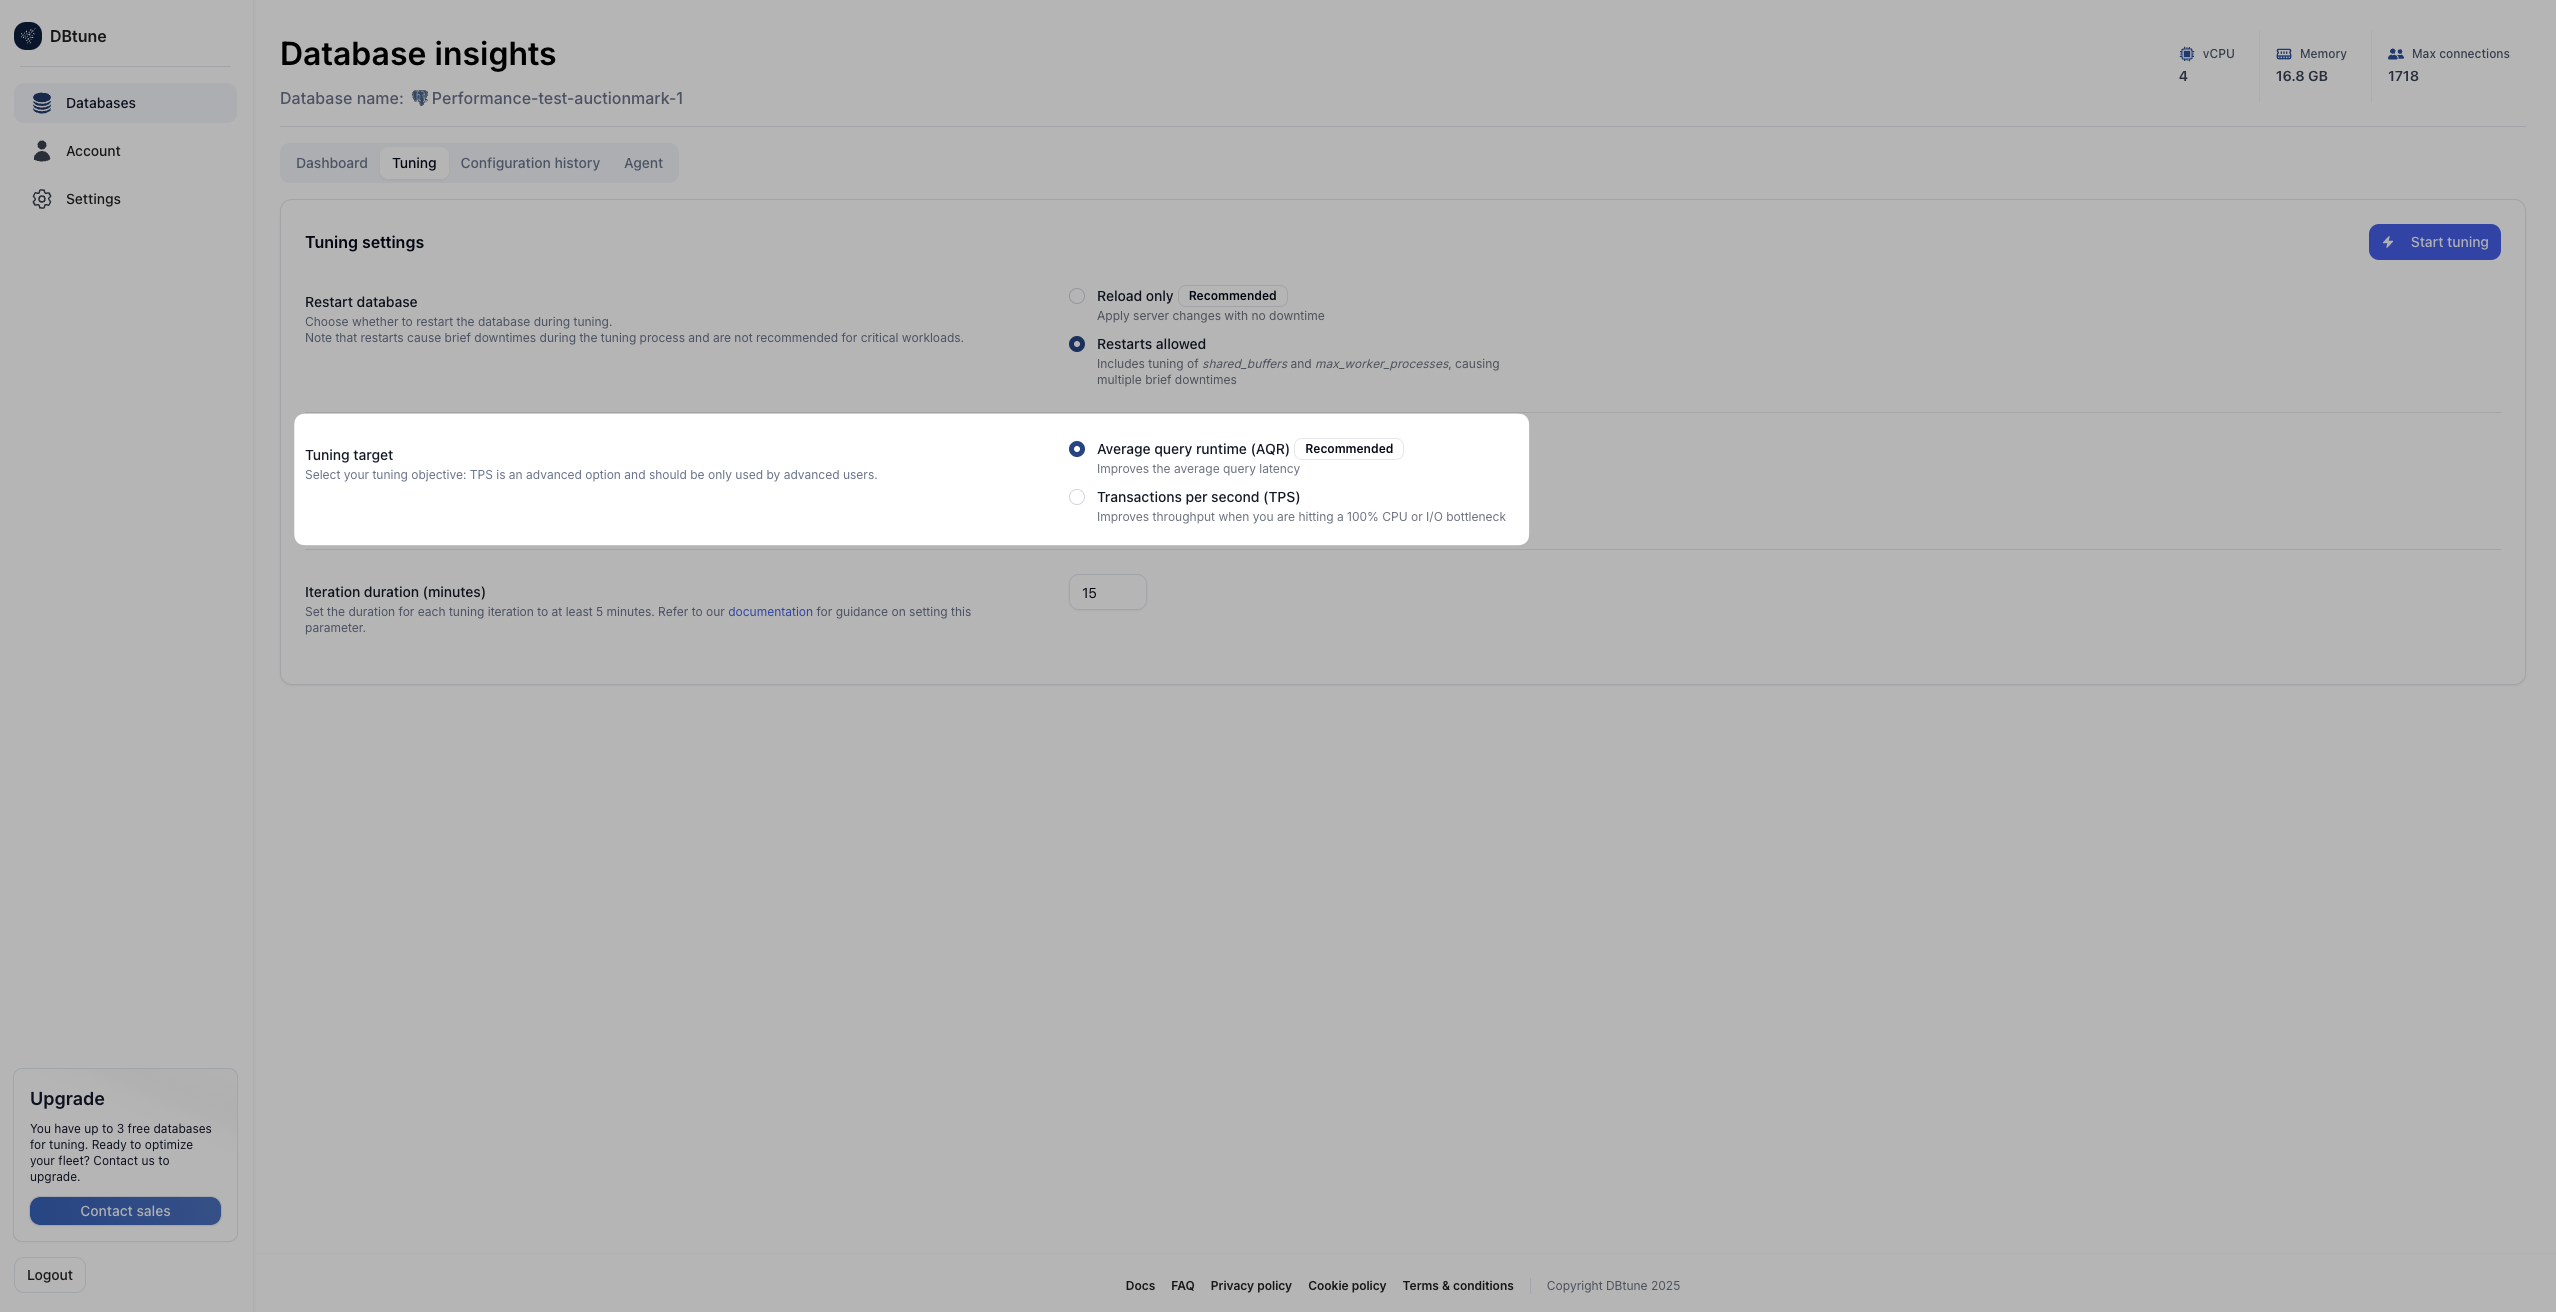
The target options are either:
- Average query runtime: This represents latency, which is measured in milliseconds (ms)
- Transactions per second: Measured in transactions per second (TPS)
The recommended target is average query runtime, which we have seen works in most cases. In case you want to be more intentional about the objective that you chose, we recommend choosing:
- Transactions per second if your machine/workload is hitting a bottleneck (either close to 100% CPU or 100% I/O), or in other words, an increased workload wouldn’t lead to increased throughput. In this scenario DBtune can help you to increase the overall throughput of your workload and achieve improved performance at peak.
- Average query runtime if your workload is composed of complex queries and you wish to reduce the average runtime of one query. The average query runtime can improve even when the machine is not bottlenecked quite as intensely. Bigger database instances will drive bigger query runtime improvement.
Note that typically, improving one optimization target will also benefit the other target. However, this choice allows our optimization engine to focus on an optimization objective.